By YAN Fusheng
By leveraging the combined power of single-cell sequencing and spatial omics, scientists are not merely observing life, but also digitizing it, creating a “Google Earth” for biology that allows us to zoom in on a single molecule and zoom out to see the architecture of consciousness itself.
This year, a series of landmark studies published in Cell have illuminated this new frontier. From the mysterious “seat of consciousness” in the primate brain to the evolutionary blueprints of vascular plants, and finally to the molecular clocks ticking within human bodies, these studies represent the first fruits of a “Big Science” approach to deciphering the complexity of life.
The Claustrum: Unlocking the Brain’s Enigmatic Conductor
Deep within the brain, hidden beneath the insular cortex, lies a thin, irregular sheet of neurons known as the claustrum. Its shape is so peculiar—curved and spiked—that it has been famously likened to a “crown of thorns.” For decades, this structure has confounded neuroscientists. The legendary Francis Crick, co-discoverer of the DNA double helix, hypothesized in his final days that the claustrum might be the “conductor of the orchestra,” the physical seat of consciousness that binds our disparate sensory experiences into a unified reality. Yet, without a detailed map, the claustrum remained a black box.
In July 2025, a joint team led by Dr. SHEN Zhiming from the Institute of Neuroscience (ION), Center for Excellence in Brain Science and Intelligence Technology of the Chinese Academy of Sciences (CAS) cracked the lid open. In their study, “Single-cell spatial transcriptome atlas and whole-brain connectivity of the macaque claustrum,” they have created the first single-cell spatial transcriptome map of this enigmatic region in primates. By combining single-cell RNA sequencing with spatial transcriptomics—a technique that assigns a “molecular fingerprint” to every cell in its precise anatomical context—the team identified 48 distinct cell types within the macaque claustrum.
Crucially, they discovered that the primate claustrum is not a monolith. It is a mosaic. The researchers identified four distinct territories, or “Projection-Selective Zones” (PSZs), each ruled by specific clusters of neurons that maintain strict diplomatic relations with the rest of the brain. Imagine a bustling international airport where passengers (neural signals) are segregated not by airline, but by their destination’s function. In the claustrum, one zone is dedicated to the “high-order” functions, dispatching signals to the prefrontal cortex to manage cognition and emotion. Another zone is wired strictly for the visual, connecting to the brain’s “eyes” in the occipital lobe. The third zone is deeply entangled with the hippocampus that handles the delicate cargo of memory.
The implications are profound. This study provides the structural proof that indeed the claustrum could act as a central switchboard, but it is far more organized than previously imagined. It does not just “bind” information; it sorts, processes, and routes it with the precision of a network engineer. By proving that specific cell types—such as the macaque-enriched GNB4+ neurons, a dominant subclass in the primate claustrum—are responsible for these specific connections, the researchers have handed us a key to understanding disorders where these connections fall apart, such as schizophrenia and autism. The “crown of thorns” is no longer a symbol of mystery, but a tangible logic gate of the primate mind.
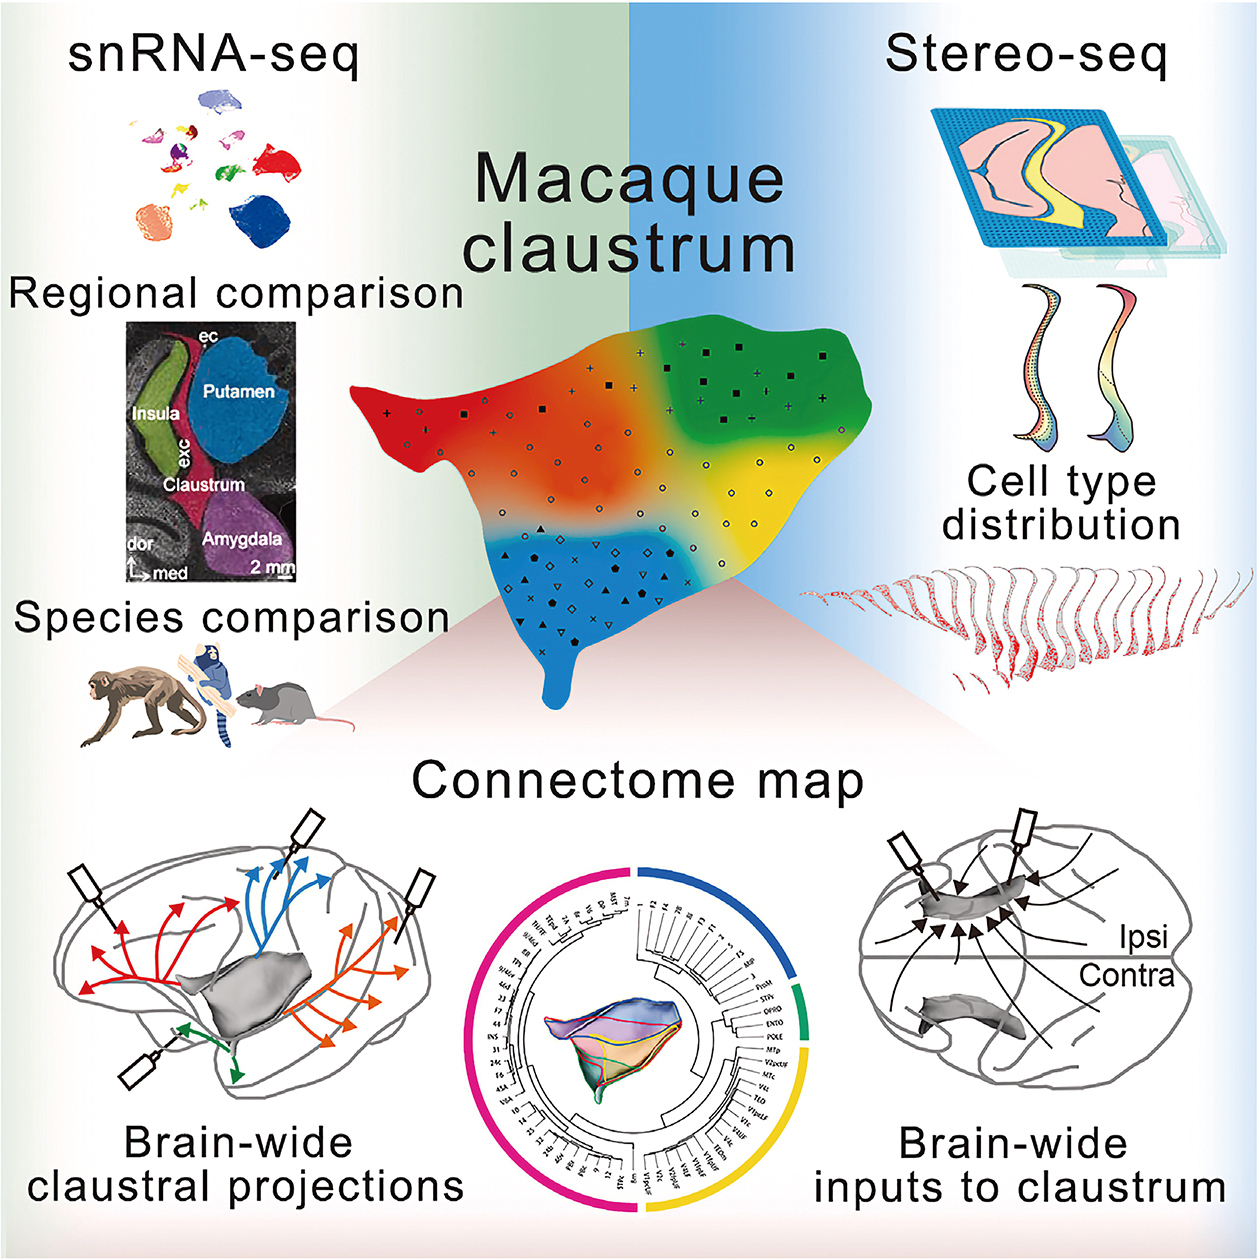
Functional Architecture of the Macaque Claustrum: By combining single-cell spatial gene profiles with a brain-wide connectivity map, this study deciphers the claustrum’s organization. It reveals four structurally and functionally distinct zones, each comprising a unique combination of cell types and forming selective communication lines with relevant cortical and subcortical areas. (Lei et al., 2025)
The Green Blueprint: A 400-Million-Year Journey
While neuroscientists map the inner space of the mind, plant biologists are charting a journey through deep time. In “A unified cell atlas of vascular plants reveals cell-type foundational genes and accelerates gene discovery,” researchers led by Dr. WANG Jiawei from the CAS Institute of Plant Physiology and Ecology (SIPPE) have achieved something akin to constructing a Periodic Table for plant life. For the first time, we have a unified single-cell map that spans the entire evolutionary breadth of vascular plants—from the ancient, moss-like lycophytes and ferns to the towering gymnosperms and the flowering angiosperms that dominate our modern world.
This is a massive undertaking, requiring the analysis of shoot apices—the plant’s growth engine—from six representative species separated by over 400 million years of evolution. The goal is to find the “foundational genes,” the immutable core programming that makes a plant a plant. The team has identified hundreds of these genetic pillars that govern the development of essential tissues like the epidermis (the skin) and the vascular system (the veins).
But the true shock came when the researchers zoomed in on a fern. For roughly a century, botany textbooks have taught that “companion cells”—specialized nurse cells that keep the nutrient-transporting sieve elements alive—are a unique innovation of flowering plants (angiosperms). Ferns and gymnosperms were thought to rely on a more primitive, less specialized system. This atlas proves the textbooks wrong. Hidden within the data of the fern Nephrolepis auriculata and the pine Pinus tabuliformis was a cluster of cells that looked, genetically speaking, suspiciously like companion cells.
Using advanced visualization techniques, the team has confirmed that these cells are indeed expressing the same molecular toolkit as their modern counterparts. It appears that nature stumbled upon the design for a high-efficiency nutrient transport system millions of years earlier than we thought. Whether this is a case of “convergent evolution”—nature inventing the same wheel twice—or a shared ancient heritage that was simply overlooked, the discovery is a testament to the power of big data. It suggests that the “green blueprint” of life is far more conservative and interconnected than the diverse shapes of a fern frond and a rose petal would suggest. This map does not just tell us where cells are; it tells us where they came from.
The Ticking Clock: The Great Decoupling at Age 50
If the first two maps describe space and evolution, the third map describes the most intimate dimension of all: time. In “Comprehensive human proteome profiles across a 50-year lifespan reveal aging trajectories and signatures,” a team of researchers spearheaded by Dr. LIU Guanghui from the Institute of Zoology, CAS, have constructed an illuminating proteome atlas of human aging. This is not a study of external wrinkles or grey hair, but a deep dive into the molecular machinery of 13 different organs, from the heart and liver to the blood vessels and skin, across individuals aged 14 to 68.
The findings challenge the comforting notion that aging is a slow, steady slide. Instead, the data reveal a dramatic “turning point”—a molecular cliff that the human body seems to walk off around the age of 50, marked by a peak in senescent proteomic fluctuations. Before this point, the body’s systems undergo gradual changes; at 50, these changes intensify into a pronounced surge. The study identifies “transcriptome-proteome decoupling” as a key signature of this disruption. In a young body, the instructions from our DNA (mRNA) are faithfully translated into functional machines (proteins). They move in lockstep. But as we age, this communication breaks down—it is as if the blueprint says “build a wall,” but the construction site is littered with broken bricks. The correlation between mRNA and protein levels plummets, particularly in the spleen and muscle, suggesting that our cells are not necessarily forgetting how to function, but are losing the ability to execute their own instructions.
The atlas also identifies the villains of this story: “senoproteins.” As the quality control systems of the cell falter, “junk” proteins begin to pile up. The study highlights Serum Amyloid P (SAP) and GAS6 as key drivers of this decline. SAP, for instance, was found to accumulate ubiquitously across aged tissues, acting like sand in the gears of our biology, promoting inflammation and vascular damage.
Perhaps the most alarming revelation is the vulnerability of our vasculature. The study found that blood vessels are among the first tissues to show signs of molecular aging, acting as a bellwether for the rest of the body. The aorta, in particular, undergoes dramatic aging-associated proteomic remodeling, releasing senoproteins that drag other organs down with it. This confirms the old medical adage that “you are only as old as your arteries,” but now we have the proteomic receipts to prove it.
A man is as old as his arteries.
—— by Thomas Sydenham
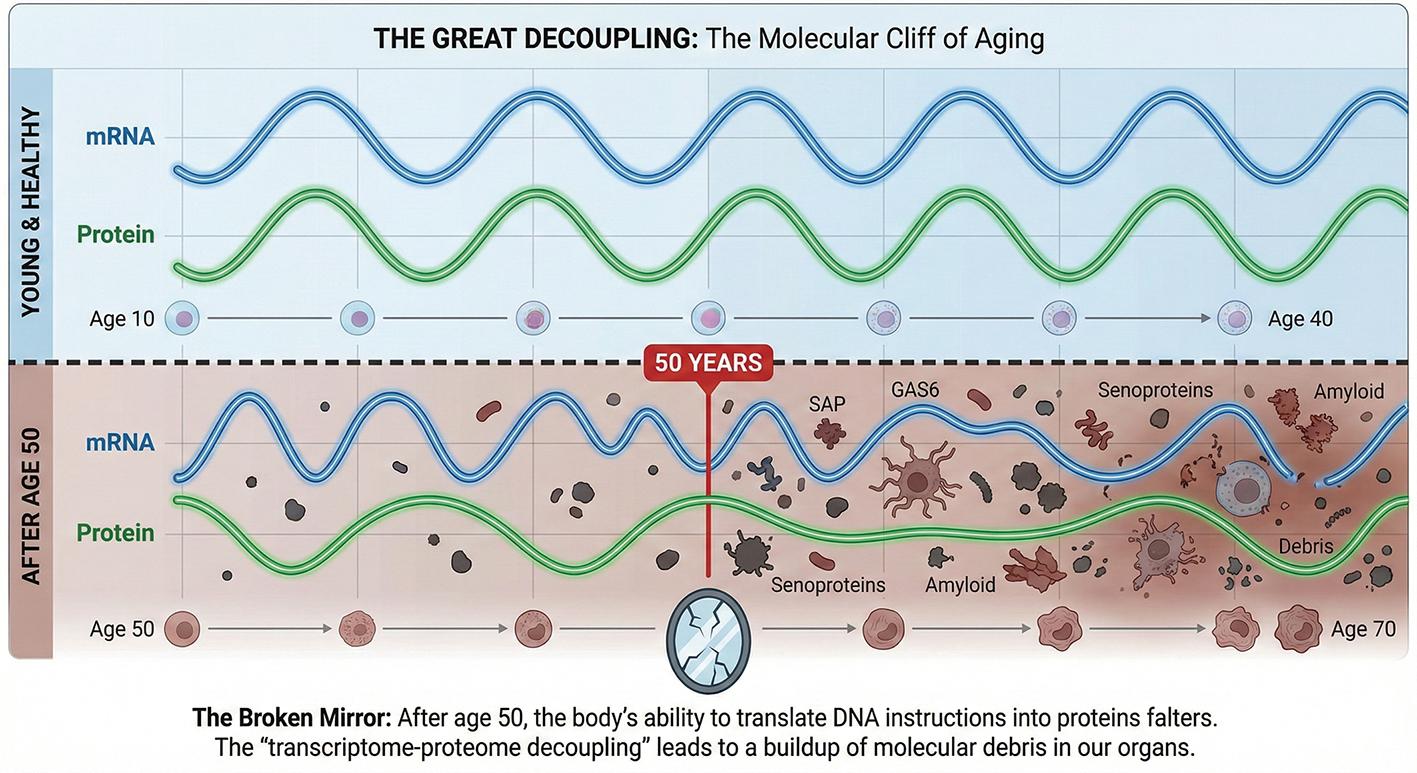
The Broken Mirror: After age 50, the body’s ability to translate DNA instructions into proteins falters. The “transcriptome-proteome decoupling” leads to a buildup of molecular debris in our organs. (Illustration generated with AI)
The “Mapping Life” Paradigm
Together, these three studies represent a paradigm shift in the life sciences. We are moving away from the era of hypothesis-driven snapshots and into the era of “Mapping Life.” Just as the first world maps transformed navigation and trade, these biological atlases are transforming medicine and agriculture.
The macaque brain atlas gives us a reference manual for the primate mind, potentially guiding future AI architectures and mental health treatments. The plant cell atlas provides a genetic toolkit for engineering crops that can withstand the changing climate, using ancient genes to solve modern problems. And the human proteome atlas offers a crystal ball for our own mortality, suggesting that if we want to extend the healthy human lifespan, we must target the “Great Decoupling” and clear out the senoprotein debris before we hit the cliff at 50.
Science is often described as the endless frontier. With these maps in hand, that frontier looks a little less daunting, and a lot more navigable.
References
Ding, Y., Zuo, Y., Zhang, B., Fan, Y., Xu, G., Cheng, Z., . . . Liu, G. H. (2025). Comprehensive human proteome profiles across a 50-year lifes pan reveal aging trajectories and signatures. Cell, 188(20), 57635784.e26. doi: 10.1016/j.cell.2025.06.047
Lei, Y., Liu, Y., Wang, M., Yuan, N., Hou, Y., Ding, L., . . . Shen, Z. (2025). Single-cell spatial transcriptome atlas and whole-brain connectivity of the macaque claustrum. Cell, 188(14), 38633881.e25. doi: 10.1016/j.cell.2025.02.037
Xue, H. C., Xu, Z. G., Liu, Y. J., Wang, L., Ming, X., Wu, Z. Y., . . . Wang, J. W. (2025). A unified cell atlas of vascular plants reveals cell-type foundational genes and accelerates gene discovery. Cell, 188(22), 63706390.e29. doi: 10.1016/j.cell.2025.07.036